v8.3-8.4
Overview
The dashboard suite is a set of dashboards that you create according to a user's specific needs. You create, edit, and configure dashboards in the dashboard suite canvas.
To create a dashboard suite, navigate to Administration > Analytics > Dashboard Suites.
To design how the canvas displays, you click-and-drag each dashboard to the necessary size.
When you create a Grid tile, you cannot use spaces in the column name. You can customize the column display name to include a space using JSON. See the JSON sample below.

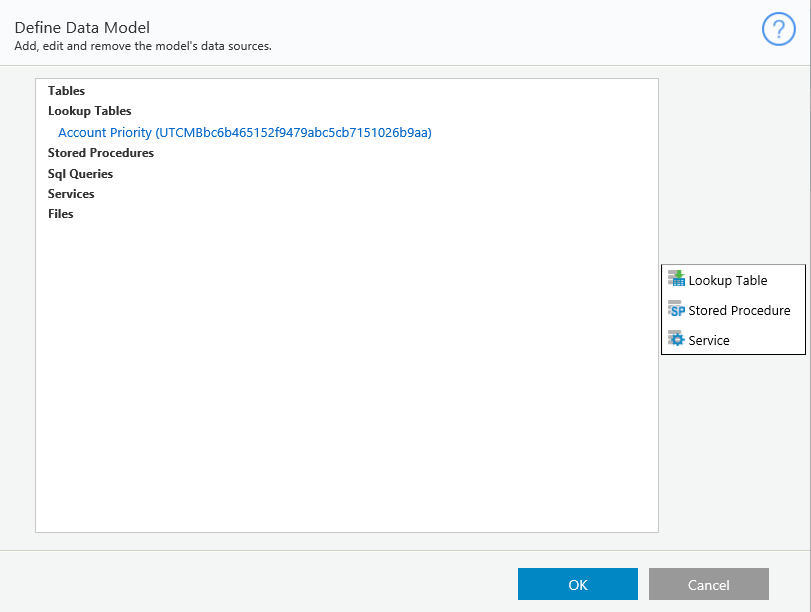
Data Model
The data source that defines the dashboard.
- Table
- Lookup Table
- Stored Procedure
- Service
- File
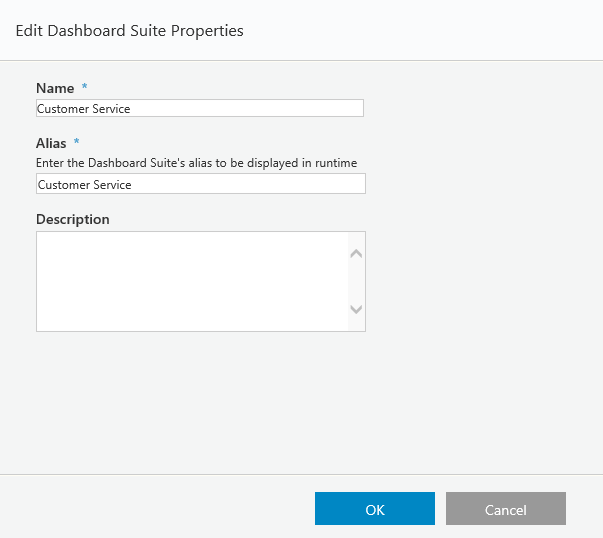
Edit Properties
- Name
- Alias
- Description
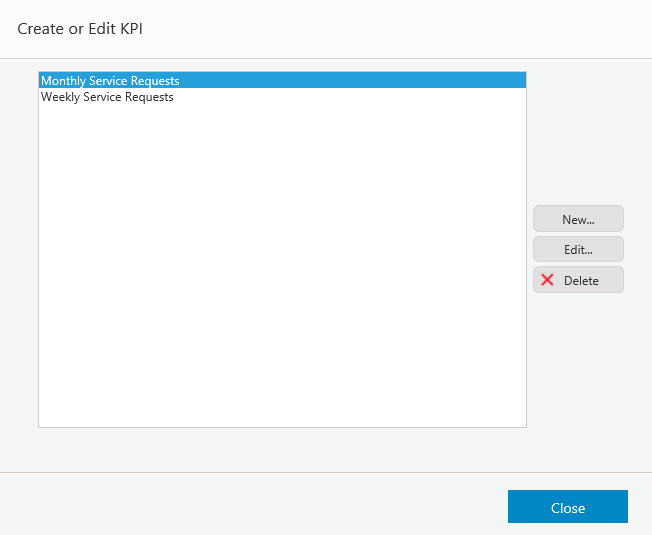
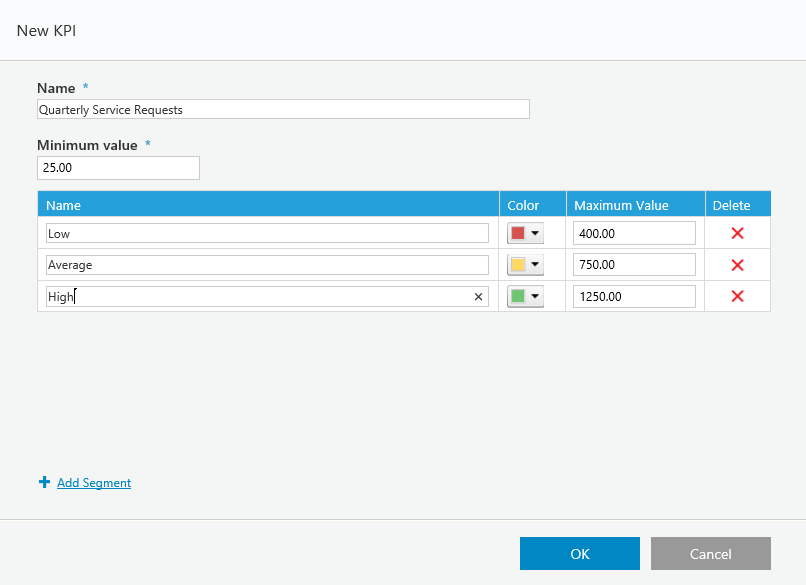
KPI
Set key performance indicators for your team to set goals.
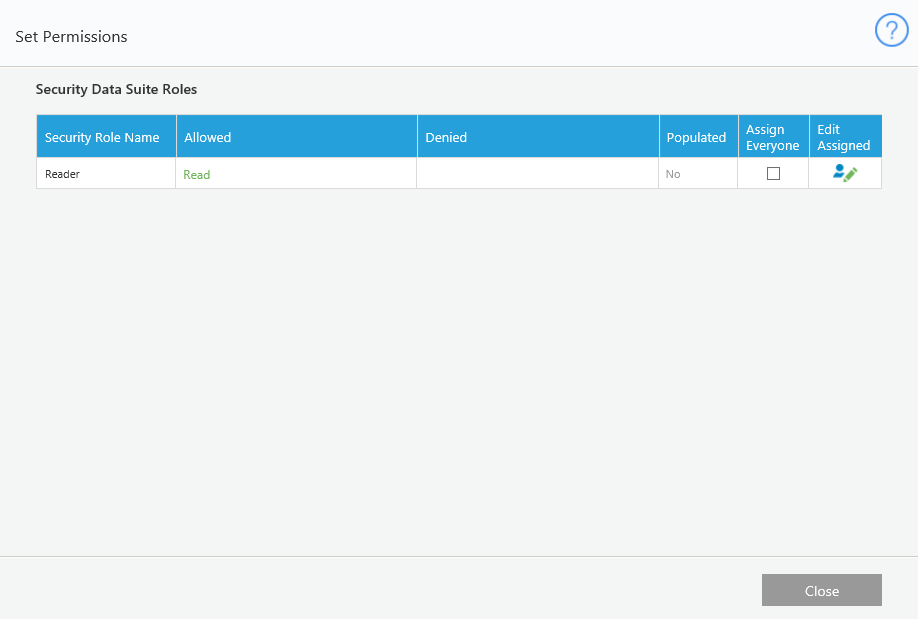
Set Permissions
Set permissions for the dashboard suite.
Data Set Structure by Chart Family
| Chart Type | Data Set Structure | |||
|---|---|---|---|---|
| Pie Doughnut Column Bar Funnel | Category | Value | ||
| Cat1 | 20 | |||
| Cat2 | 30 | |||
| Cat3 | 50 | |||
| Area Line Line Column Stacked Column Multi Series | Category | Value1 | Value2 | ValueN |
| Cat1 | 20 | 50 | 90 | |
| Cat2 | 30 | 60 | 100 | |
| Cat3 | 50 | 80 | 150 | |
| Grid | Category | Value1 | Value2 | ValueN |
| Cat1 | Text1 | 50 | 80$ | |
| Cat2 | Text2 | 60 | 100$ | |
| Cat3 | Text3 | 80 | 120% | |
v8.5
Overview
The dashboard suite is a set of dashboards that you create according to a user's specific needs. There are two types of dashboard suites, HotOperations and Analytics. You create, edit, and configure dashboards in the dashboard suite canvas.
To create both types of dashboard suites, navigate to Administration > Analytics > Dashboard Suites. For more information about creating dashboard suites, see the following articles.
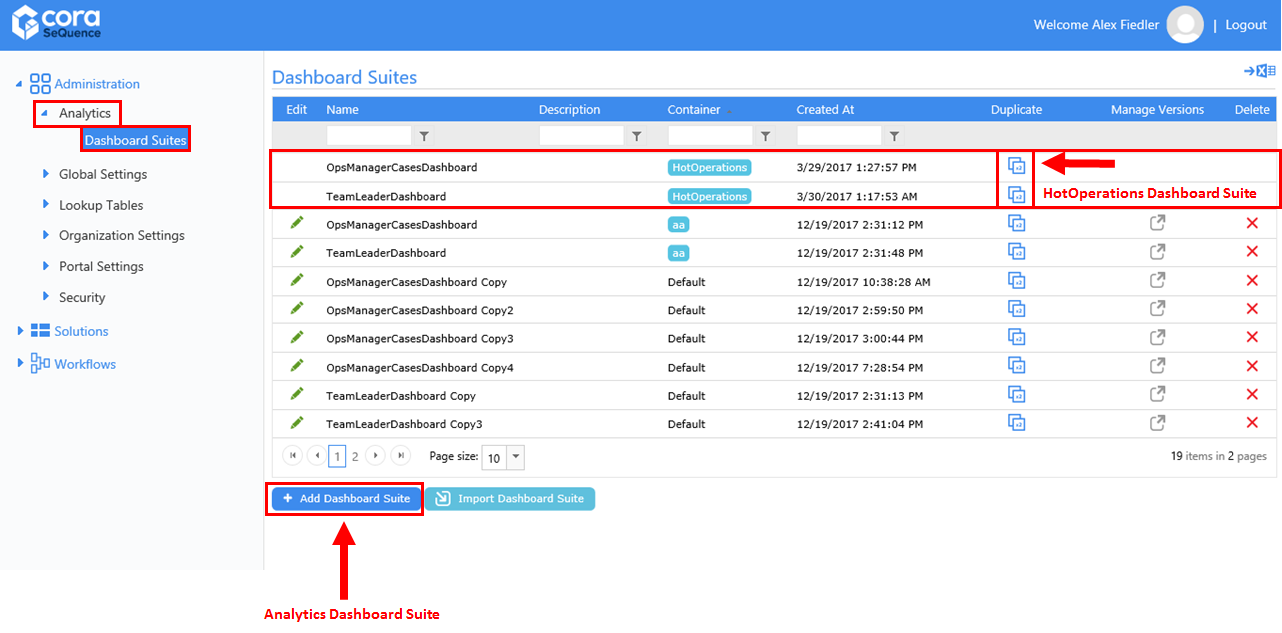
HotOperations Dashboard Suites
There are two source dashboard suites that you can duplicate in order to edit and modify for your environment. You cannot modify or delete the source dashboard suites. To create a new HotOperations dashboard suite, duplicate one of the source dashboard suites.
HotOperations Source Dashboard Suites
| Dashboard Suite | Description |
|---|---|
| OpsManagerCasesDashboard | By default, this dashboard suite contains two dashboards, Board and OpsManagerCasesDashboard. These are the out-of-the-box dashboards that display in Flowtime.
|
| TeamLeaderDashboard | By default, this dashboard suite contains two dashboards, Board and TeamLeaderDashboard. These are the out-of-the-box dashboards that display in Flowtime.
|
Dashboard Suite Canvas
To design how the canvas displays, you click-and-drag each dashboard to the necessary size.
When you create a Grid tile, you cannot use spaces in the column name. You can customize the column display name to include a space using JSON. See the JSON sample below.
Data Model
The data source that defines the dashboard.
- Table
- Lookup Table
- Stored Procedure
- Service
- File
Edit Properties
- Name
- Alias
- Description
KPI
Set key performance indicators for your team to set goals.
Set Permissions
Set permissions for the dashboard suite.
Data Set Structure by Chart Family
| Chart Type | Data Set Structure | |||
|---|---|---|---|---|
| Pie Doughnut Column Bar Funnel | Category | Value | ||
| Cat1 | 20 | |||
| Cat2 | 30 | |||
| Cat3 | 50 | |||
| Area Line Line Column Stacked Column Multi Series | Category | Value1 | Value2 | ValueN |
| Cat1 | 20 | 50 | 90 | |
| Cat2 | 30 | 60 | 100 | |
| Cat3 | 50 | 80 | 150 | |
| Grid | Category | Value1 | Value2 | ValueN |
| Cat1 | Text1 | 50 | 80$ | |
| Cat2 | Text2 | 60 | 100$ | |
| Cat3 | Text3 | 80 | 120% | |
