Starting with V11.1, Cora Orchestration has been renamed to Orchestration AI.
V11.1
Overview
Integrations dashboard feature enables a system administrator to access a dedicated application from the Admin site to monitor, manage and test all system integrations efficiently. Centralized monitoring of system integrations reduces the need for manual oversight and improves overall system reliability. The capability of early identification of any connectivity issues drives greater operational efficiency. The dashboard provides real-time visibility of integrations status and health, supporting faster troubleshooting and more informed decision-making.
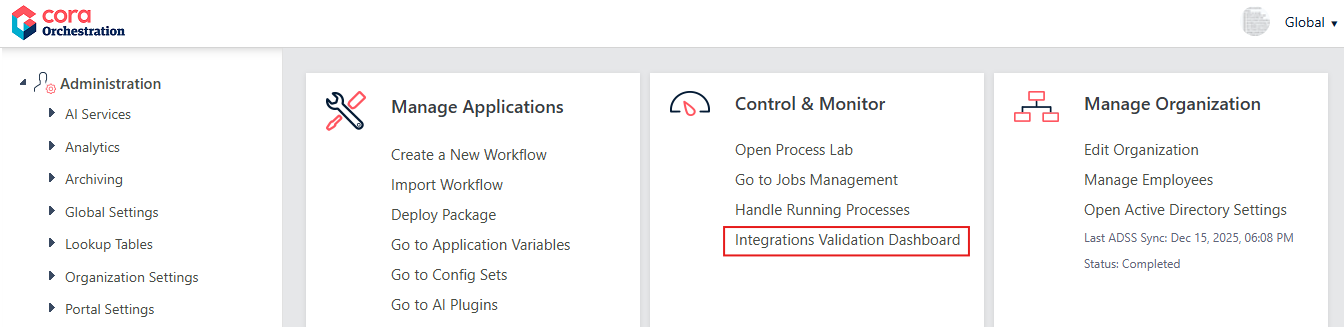
Access Integrations Dashboard
The Integrations Validation Dashboard application appears in the Control & Monitor tile in the Admin site home page. You can click the option to open the integrations dashboard.
The integrations dashboard displays all your enabled and disabled system integrations in one place. At present, the following integrations are displayed in the dashboard:
- Connection Strings
- Service Bus Connections
- Email Sending Connections
- Kafka Connections
- File Connections
From the dashboard, you can filter the view to display integrations based on their status, choose from All, enabled or disabled from the drop down.
- All: Displays all the system integrations.
- Enabled: Displays only enabled integrations.
- Disabled: Displays only disabled integrations.
From the dashboard you can perform the following actions on the integrations, thus saving you time and effort to navigate to the integration's actual page:
- Edit: The crayon option enables you to edit any listed integration from the dashboard.
- Validate: The validate option enables you to validate any integration from the dashboard.
- Mark for automatic validation/health check: Selecting the automate check box enables you to set up a schedule for automatic validation/health checkup of the integration.
- View history: The icon enables you to view history log of the selected integration. The log displays the Last validation result, Success or Failure.
For integration endpoints marked for automatic validation, the Automatic Integration Validation system job runs scheduled validations.
Following are the job's default settings:
Job tab
- Scalability: disabled (single instance)
- Supports redundancy: Yes
- Run on host: any
Command tab
- onFailureWfSpaceGuid: (Optional), Guid of the workflow space to start, if a validation fails. Default is empty.
Advanced options tab
- Repeats by: Custom
- Frequency: Daily
- Occurs Once at: 06:00AM
- Delay job Start: No delay
- Stop job if it executes more than: 30 minutes
- If a job is currently running, do not start the next job until the current job completes/finishes: True
As a workflow developer, you can stop the system job anytime.
V10.10.1
Overview
Integrations dashboard feature enables a system administrator to access a dedicated application from the Admin site to monitor, manage and test all system integrations efficiently. Centralized monitoring of system integrations reduces the need for manual oversight and improves overall system reliability. The capability of early identification of any connectivity issues drives greater operational efficiency. The dashboard provides real-time visibility of integrations status and health, supporting faster troubleshooting and more informed decision-making.
Access Integrations Dashboard
The Integrations Validation Dashboard application appears in the Control & Monitor tile in the Admin site home page. You can click the option to open the integrations dashboard.
The integrations dashboard displays all your enabled and disabled system integrations in one place. At present, the following integrations are displayed in the dashboard:
- Connection Strings
- Service Bus Connections
- Email Sending Connections
From the dashboard you can filter the view to display integrations based on their status, choose from All, enabled or disabled from the drop down.
- All: Displays all the system integrations.
- Enabled: Displays only enabled integrations.
- Disabled: Displays only disabled integrations.
From the dashboard you can perform the following actions on the integrations, thus saving you time and effort to navigate to the integration's actual page:
- Edit: The crayon option enables you to edit any listed integration from the dashboard.
- Validate: The validate option enables you to validate any integration from the dashboard.
- Mark for automatic health check: Selecting the automate check box enables you to set up a schedule for automatic health checkup of the integration.
